An International Energy Agency Newsletter
Click here to view in your browser
Welcome back to Energy Snapshot, the International Energy Agency’s monthly newsletter focused on charts and data. In today’s edition, we look at the surge of LNG capacity that is set to come online by the end of this decade.
 
Were you forwarded this email? You can subscribe here.
In 2022, natural gas markets entered a period of crisis after Russia cut pipeline supplies to Europe. This move ushered in a period of extreme price volatility and fostered deep concerns about the security of supply, which continue to inform policy decisions around the world today.
 
Since then, the global market has gradually rebalanced – and liquefied natural gas, or LNG, has played a major role in helping it regain its footing, with natural gas prices trending back towards their pre-crisis levels.
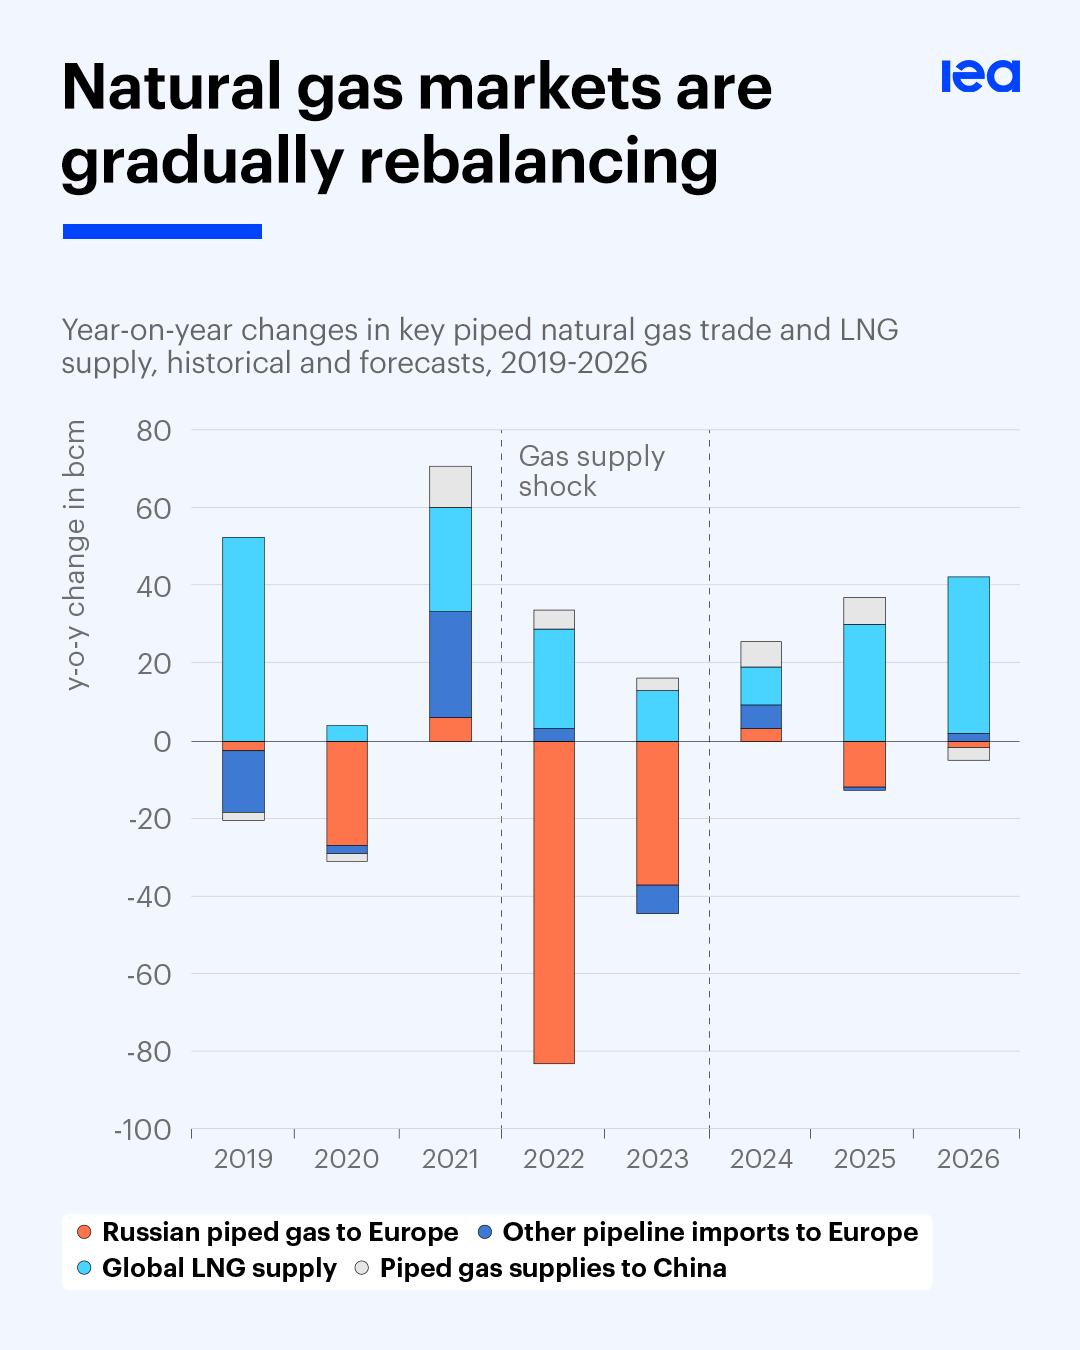
Markets remain tight today. Yet in the coming years, the global natural gas market is poised to transition to a period of abundant supply – largely due to a record wave of expected new capacity to produce and export LNG.
 
Based on today’s plans, between 2025 and 2030, nearly 300 billion cubic metres (bcm) per year of new liquefaction capacity is set to arrive from projects that have already reached a final investment decision or are under construction, according to a recent update of the IEA’s Global LNG Capacity Tracker. This equates to adding around half of the total global LNG market today.
 
The outlook is subject to a range of uncertainties, from construction delays to new progress on projects that have been approved but are currently stalled. However, a capacity increase of this scale would have significant implications for global gas markets.
 
The growth is set to be led by the United States, Qatar and Canada. Together, projects in these countries account for around 80% of expected capacity additions to 2030.
To learn more, explore our Global LNG Capacity Tracker. You can also read the latest edition of our quarterly Gas Market Report. The fourth quarter edition, with the IEA’s latest data and analysis, will publish next month.
Thank you for reading. Any thoughts or feedback? Send them our way at energysnapshot@iea.org.
 
If you’re enjoying the newsletter, you can invite others to sign up here. And feel free to share our charts on platforms like X or LinkedIn.
 
We’ll be back in your inboxes with more charts based on IEA data and analysis in October.