|
An International Energy Agency Newsletter
Click here to view in your browser
|
|
Welcome back to Energy Snapshot, the International Energy Agency’s monthly newsletter focused on charts and data. In this edition, we look at the rapid rise in demand for air conditioning.
|
Around the world, demand for air conditioning is growing. As incomes rise, more people can afford to buy AC units – and amid record-breaking heatwaves, many more want them.
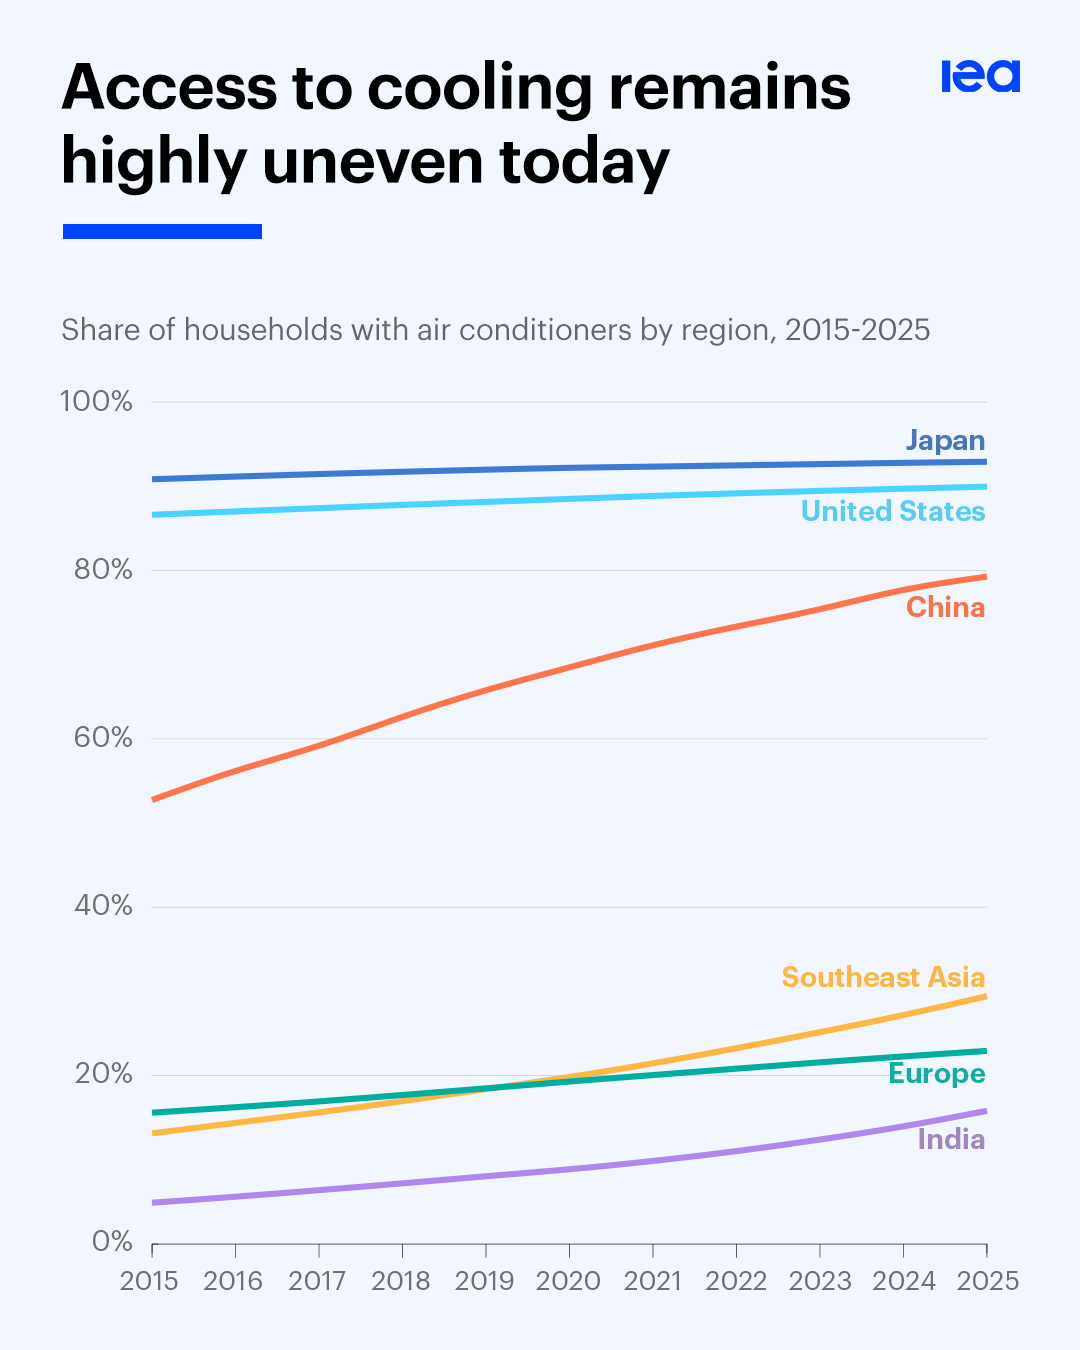
Today, access to cooling remains highly uneven globally. Nearly 90% of households in Japan and the United States have an air conditioner, while ownership rates remain substantially lower in Southeast Asia and India, despite significant cooling needs due to their hot climates. In China, access to cooling has also expanded rapidly, with ownership rising by 50% over the past decade.
But changes are starting to take hold as the adoption of air conditioning accelerates, driven by a growing middle class in many hot-climate economies and by record-breaking heatwaves in regions that previously had only limited cooling demand. At the same time, falling unit prices and elevated inventories across the supply chain are making air conditioners more affordable and readily available. As a result, annual AC unit shipments are now 25% higher than they were five years ago – fuelled largely by growth in emerging and developing economies.
|
|
This growth is bringing the benefits of cooling comfort to many. But it also presents challenges for electricity systems – especially at a time when power demand is also increasing because of industrial expansion and electrification, rising electric vehicle uptake, the rapid growth of data centres, and other factors.
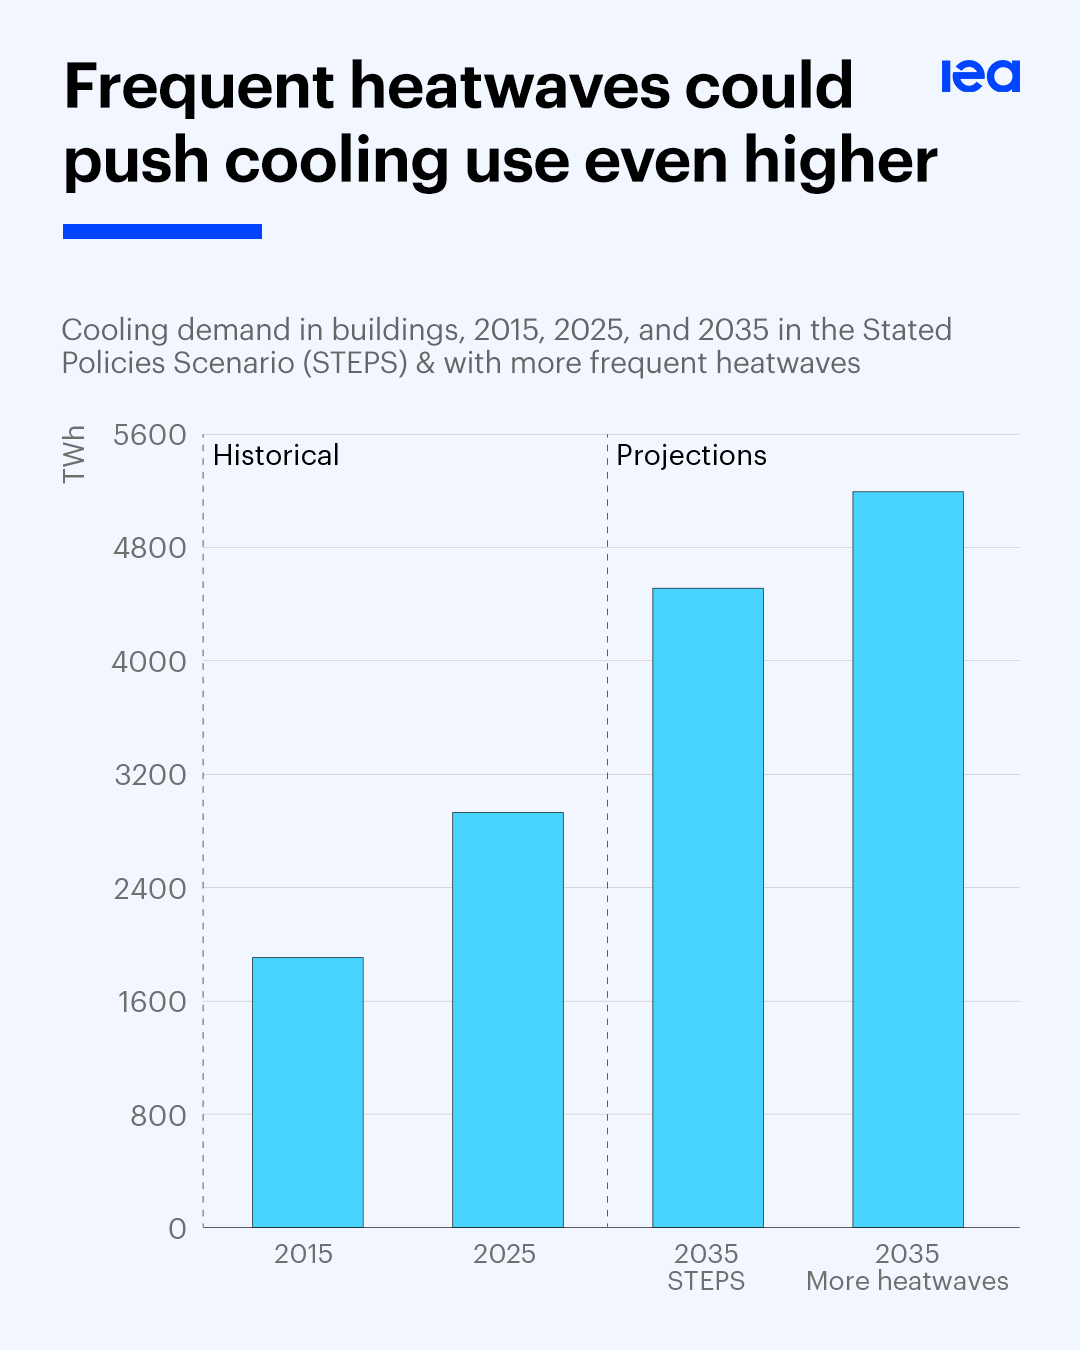
Globally, electricity demand for space cooling – which also includes fans and other cooling technologies such as district cooling – rose by about 50% between 2015 and 2025. Last year, it surpassed 2,900 terawatt-hours, more than the total electricity demand of the entire European Union. By 2035, based on today’s policy settings, it is set to surpass 4,500 terawatt-hours.
Meteorologists warn that El Niño – a periodic warming of Pacific Ocean surface waters – could drive a new series of extreme weather events in 2026 and 2027. Our new analysis explores the potential impact of these events, and finds that if a strong El Niño event develops this year and next – and weather events of a similar magnitude occur every three years thereafter – global cooling demand would increase by an additional 700 terawatt-hours by 2035.
|
|
Fortunately, many of the measures needed to help ease strains on electricity systems are already well understood. For example, enabling buildings to use power more flexibly can shift energy-intensive activities away from periods of peak electricity demand, reducing pressure on grids.
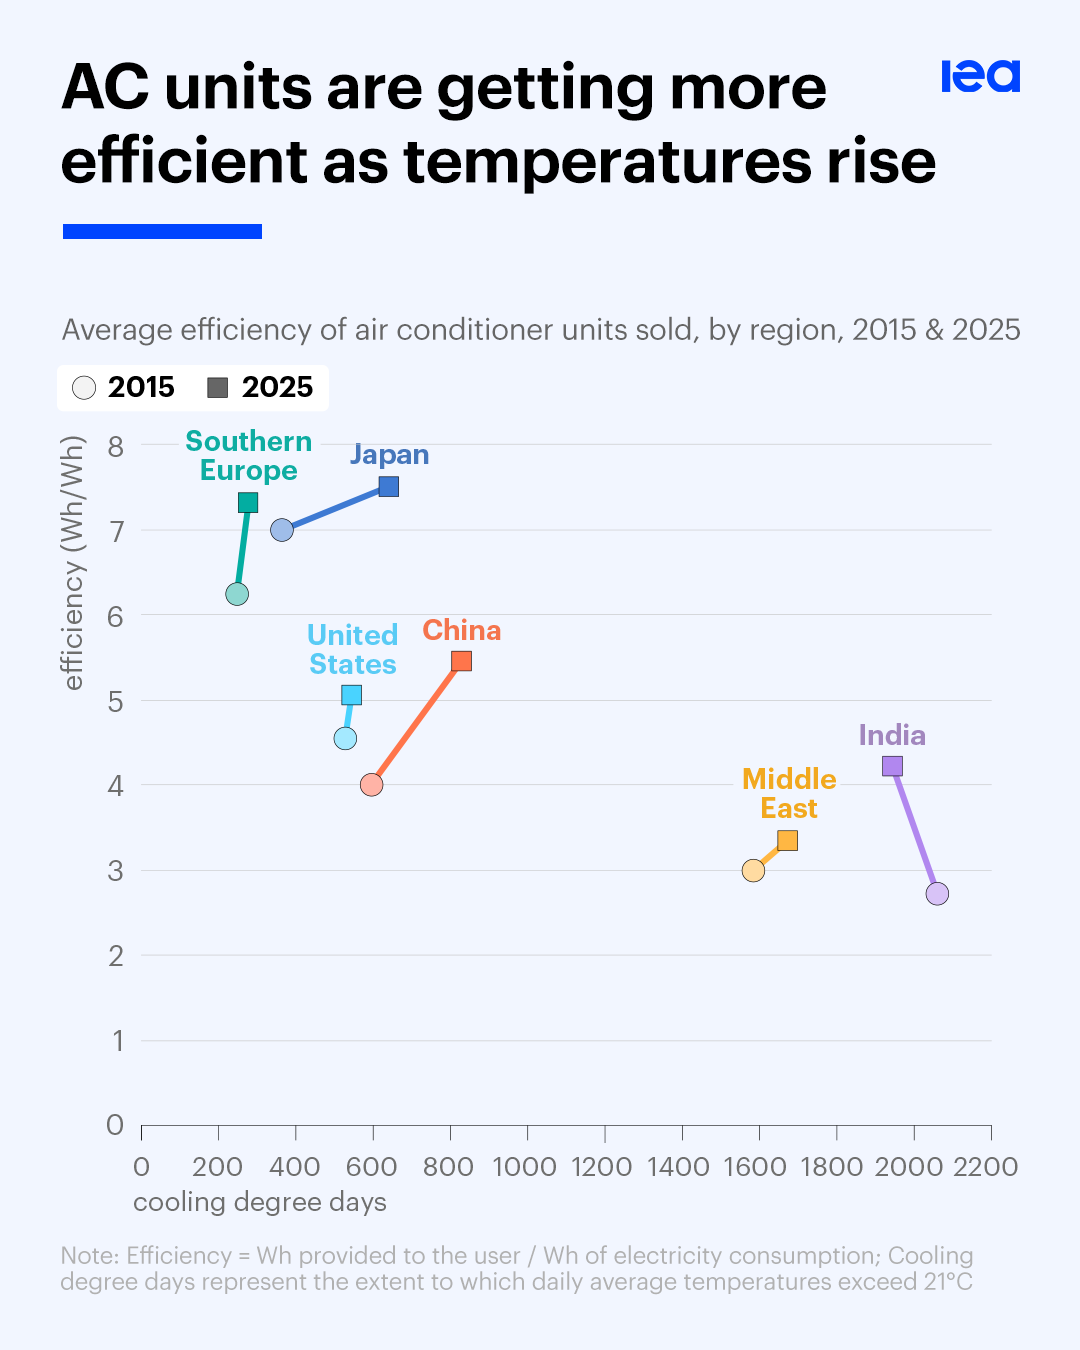
Continuous improvements in energy efficiency are central to strengthening electricity security while lowering costs for households and power systems. There are large differences in the efficiency of air conditioners available today: the most efficient air conditioning units can be up to four times as efficient as the least efficient models, and more than twice as efficient as the average unit sold.
Average equipment efficiency has also improved steadily in recent years, supported by falling prices for high-efficiency models and tighter energy performance standards, which are now in place in over 100 countries. As a result, the average AC unit sold globally in 2024 was around 20% more efficient than the average model sold a decade earlier.
|
|
If you’re enjoying the newsletter, you can invite others to sign up here. And feel free to share our charts on platforms like X or LinkedIn.
We’ll be back in your inboxes with more charts based on IEA data and analysis in August.
|
|
|
|
|
